Agent Observability: Debugging Reasoning, Not Code


When a traditional program breaks, you read the stack trace. You find the line that failed, you understand why, you fix it. That reflex is twenty years of muscle memory for most engineers, and it stops working the moment you put a language model in the loop.
When an agent breaks, there is often no stack trace at all. No exception, no failed function, no red line. The code ran exactly as written. What failed was a decision the model made while running that code, and a decision is not a line you can open in an editor.
Agent observability is the discipline of capturing those decisions so you can debug and evaluate them. It borrows the vocabulary of traditional observability, traces and spans, but it captures something different: not which service was called and how long it took, but what the model was thinking, what it had to work with, and why it chose what it chose. This post walks through the primitives it rests on, how those same primitives become your evaluation suite, and a concrete example of instrumenting a real production system, all the way down to a system that makes a single model call.
Agent observability is not software observability
Pre-LLM software held two properties that made debugging tractable. It was deterministic: the same input produced the same output. And the code was the record: you could read the source and know what the system did.
Moving from traditional software to LLM applications to agents erodes both, one step at a time. A traditional program is deterministic. An LLM application makes a single model call, introducing the fuzziness of natural language but staying constrained to one call. An agent calls models and tools in a loop, reasoning across dozens or hundreds of steps, maintaining state, adapting to context. By the time you reach agents, behavior is fully non-deterministic and the code no longer records what happened.
You still write the code. You define the tools, wire up the data, and write the prompts and tool descriptions. But you do not know how the model will interpret any of it until you run it. The source of truth quietly moves from the code to the trace of what the model actually did.
You write the rules of the game. The model plays the moves. You cannot read the moves in the code, because the moves have not happened yet.
That single shift is why agent observability is its own discipline rather than a reskin of application monitoring.
The three primitives: runs, traces, and threads
Agent observability rests on three nested primitives. Get these clear and most of the field stops being confusing.
A run is one model call. Its full prompt, the tools available to it, the input, and the output. It is the smallest unit where a single decision is made.
Consider a scheduling agent told "set up a meeting with Harrison tomorrow morning," with three tools available: find_meeting_times, schedule_meeting, send_email. The correct first move is to check availability. Booking a slot blind is the failure. A run captures which one it chose and the exact context that informed the choice.
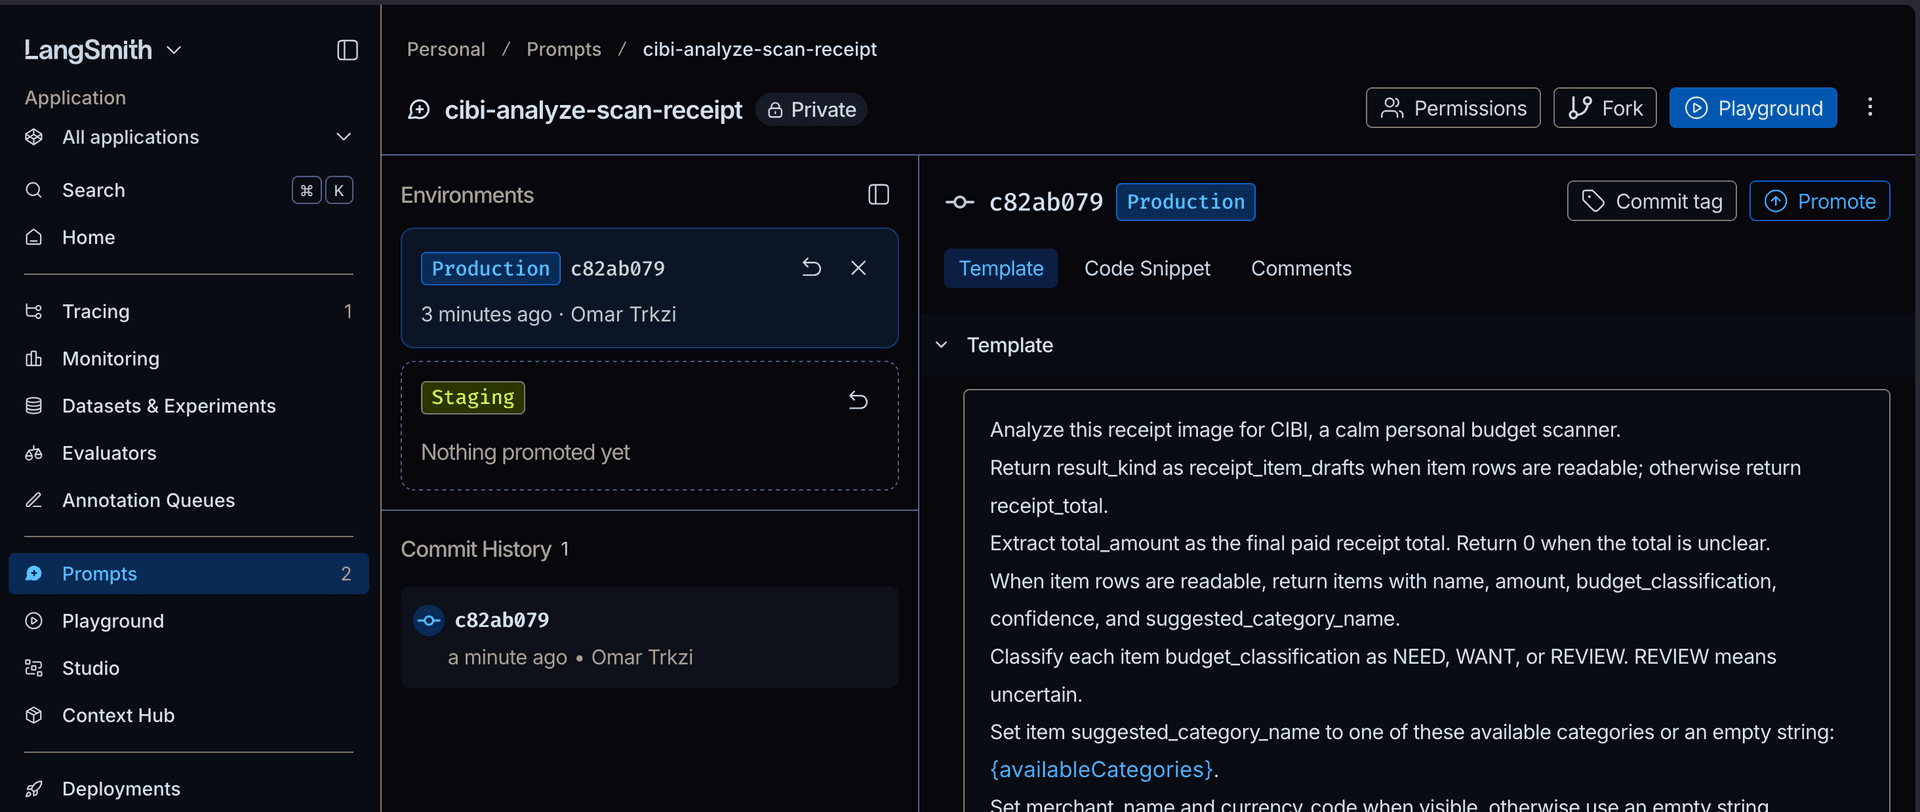
A real example of what backs a run: CIBI's own production system prompt, versioned in LangSmith rather than buried in a string constant.
A trace is every run in one execution, linked together. It is the trajectory: all the model calls, all the tool calls with their arguments and results, and the nesting that shows how steps relate. For a coding agent fixing a bug, the trace is where you confirm it read the file before editing it and ran the tests afterward. Agent traces are large. A distributed trace in traditional software might be a few hundred bytes; a long-running agent trace can reach hundreds of megabytes, because the reasoning context is the point.
CIBI's own trace is flat, a single run with no nested tree, so there is nothing to screenshot here. For what a deeply nested trace actually looks like, see LangChain's "Fundamentals of Agent Observability" guide.
A thread is several traces grouped as one conversation. It preserves multi-turn context, how state evolves across turns, and a time span that can stretch across minutes, hours, or days.
The value of threads shows up in a specific failure. An agent behaves for ten turns, then makes a mistake on the eleventh. The turn-eleven trace, read alone, looks fine: a reasonable tool, reasonable arguments. Only the full thread reveals the cause, that in turn six the agent wrote a wrong assumption into its own memory, and by turn eleven that bad context had compounded into broken behavior. The failing trace is innocent. The thread is the crime scene.
CIBI has no threads either, each scan is a single isolated call with no memory across turns. See the same LangChain guide for a real multi-turn thread example.
Evaluating agents maps onto the same primitives
Traditional software testing checks code paths at different granularities: unit, integration, end to end. Agent evaluation keeps the idea of granularity but changes what you test. You are no longer testing code paths. You are testing reasoning, and the levels map one to one onto the primitives:
- Single-step evaluation validates a run. Did the model make the right decision at this moment?
- Full-turn evaluation validates a trace. Did the agent complete the whole task correctly?
- Multi-turn evaluation validates a thread. Did the agent hold context across the conversation?
A single-step test is a unit test for a decision. Set up a state, run one step, assert on the choice:
1setup:  history = "set up a meeting with Harrison tomorrow morning"
2        tools   = [find_meeting_times, schedule_meeting, send_email]
3step:   run the agent for exactly one step
4assert: it called find_meeting_times, not schedule_meeting
Full-turn tests widen the lens to trajectory (were the right tools called, in a defensible order), final response quality, and state changes (did the agent write the right files or store the right memory). Multi-turn tests check that context persists: tell the agent you prefer Python in turn one, and it should still be handing you Python in turn three.
Choosing what granularity to evaluate at
There is no single correct level. Each buys something and charges for it, and pretending otherwise is how eval suites rot.
- Run level (single-step) is the easiest to score automatically, often just a check of which tool fired. The cost: these tests go stale fast when you change your tool set or call order. Build them once the architecture stabilizes.
- Trace level (full-turn) is the easiest to feed, because the inputs are simply inputs to your agent. Defining a metric for the output is the hard part.
- Thread level (multi-turn) is the most realistic and the most brutal. The input is a whole sequence that only makes sense if the agent behaves a certain way between turns, and scoring it automatically is genuinely painful. This is the rarest kind of eval in practice.
This comparison is conceptual rather than a screenshot; see LangChain's "Fundamentals of Agent Observability" guide for the full breakdown.
A reasonable default: live at the trace level day to day, and layer in single-step tests once the architecture stops moving.
Production is where your test set comes from
Here is the shift that separates agent evaluation from software testing. In traditional software, offline tests catch most correctness issues and production catches the edge cases you missed. With agents, production is where you discover what the edge cases are. Every natural-language input is unique, so you cannot anticipate how users will phrase requests or which cases exist. Offline evaluation is necessary but not sufficient.
That reframes production traces as raw material. When a verdict comes back wrong, you have the exact input and the exact reasoning, which means you have a test case:
11. a user reports incorrect behavior
22. find the production trace
33. extract the state at the failure point
44. turn that state into an offline test case
55. fix, then validate against it forever
The same traces also power online evaluation, which runs continuously on production traffic: trajectory checks that flag unusual tool-call patterns, efficiency monitoring for performance drift, LLM-as-judge quality scoring on live outputs, and failure alerts that surface errors before users report them. And when a trace runs to a hundred thousand lines, AI-assisted analysis becomes the only practical way to query it. In one case, instead of manually reading a 150-step trace, an assistant surfaced that an agent was calling read_file repeatedly on the same file instead of caching it in context. The fix was a one-line prompt change. Spotting it by hand would have taken hours.
Observability and evaluation are the same discipline
Traditional software kept tracing and testing in separate drawers. Tracing was for debugging after the fact; testing was for validation before it. Different tools, different headspace.
For agents they fuse, because they run on the same artifact. The trace you capture to debug a failure is the exact trace you turn into an eval. You need reasoning traces to understand behavior, and you need systematic evaluation to make sense of traces at scale. The teams that adopt both together, from day one, are the ones shipping agents that hold up.
Proof: instrumenting a single model call
The clearest test of whether you believe all this is whether you apply it below the point where it feels obviously necessary. So here is a real one.
CIBI, a scan-to-verdict finance app I build, makes exactly one model call. You scan a purchase, it pulls your live budget from Supabase, sends the image and that budget context to Gemini once, and shows a verdict: Safe, Careful, or Over. No loop, no memory, no conversation. By the strict definition it is not an agent at all. It is a single run.
It still earned full instrumentation, because the verdict only looks like arithmetic. The 50/30/20 math is deterministic and boring to test, but two decisions inside that one call are not: reading the right amount off a messy receipt, and judging whether a purchase is a want or a need. Those are model judgments, and a judgment needs to be observable.
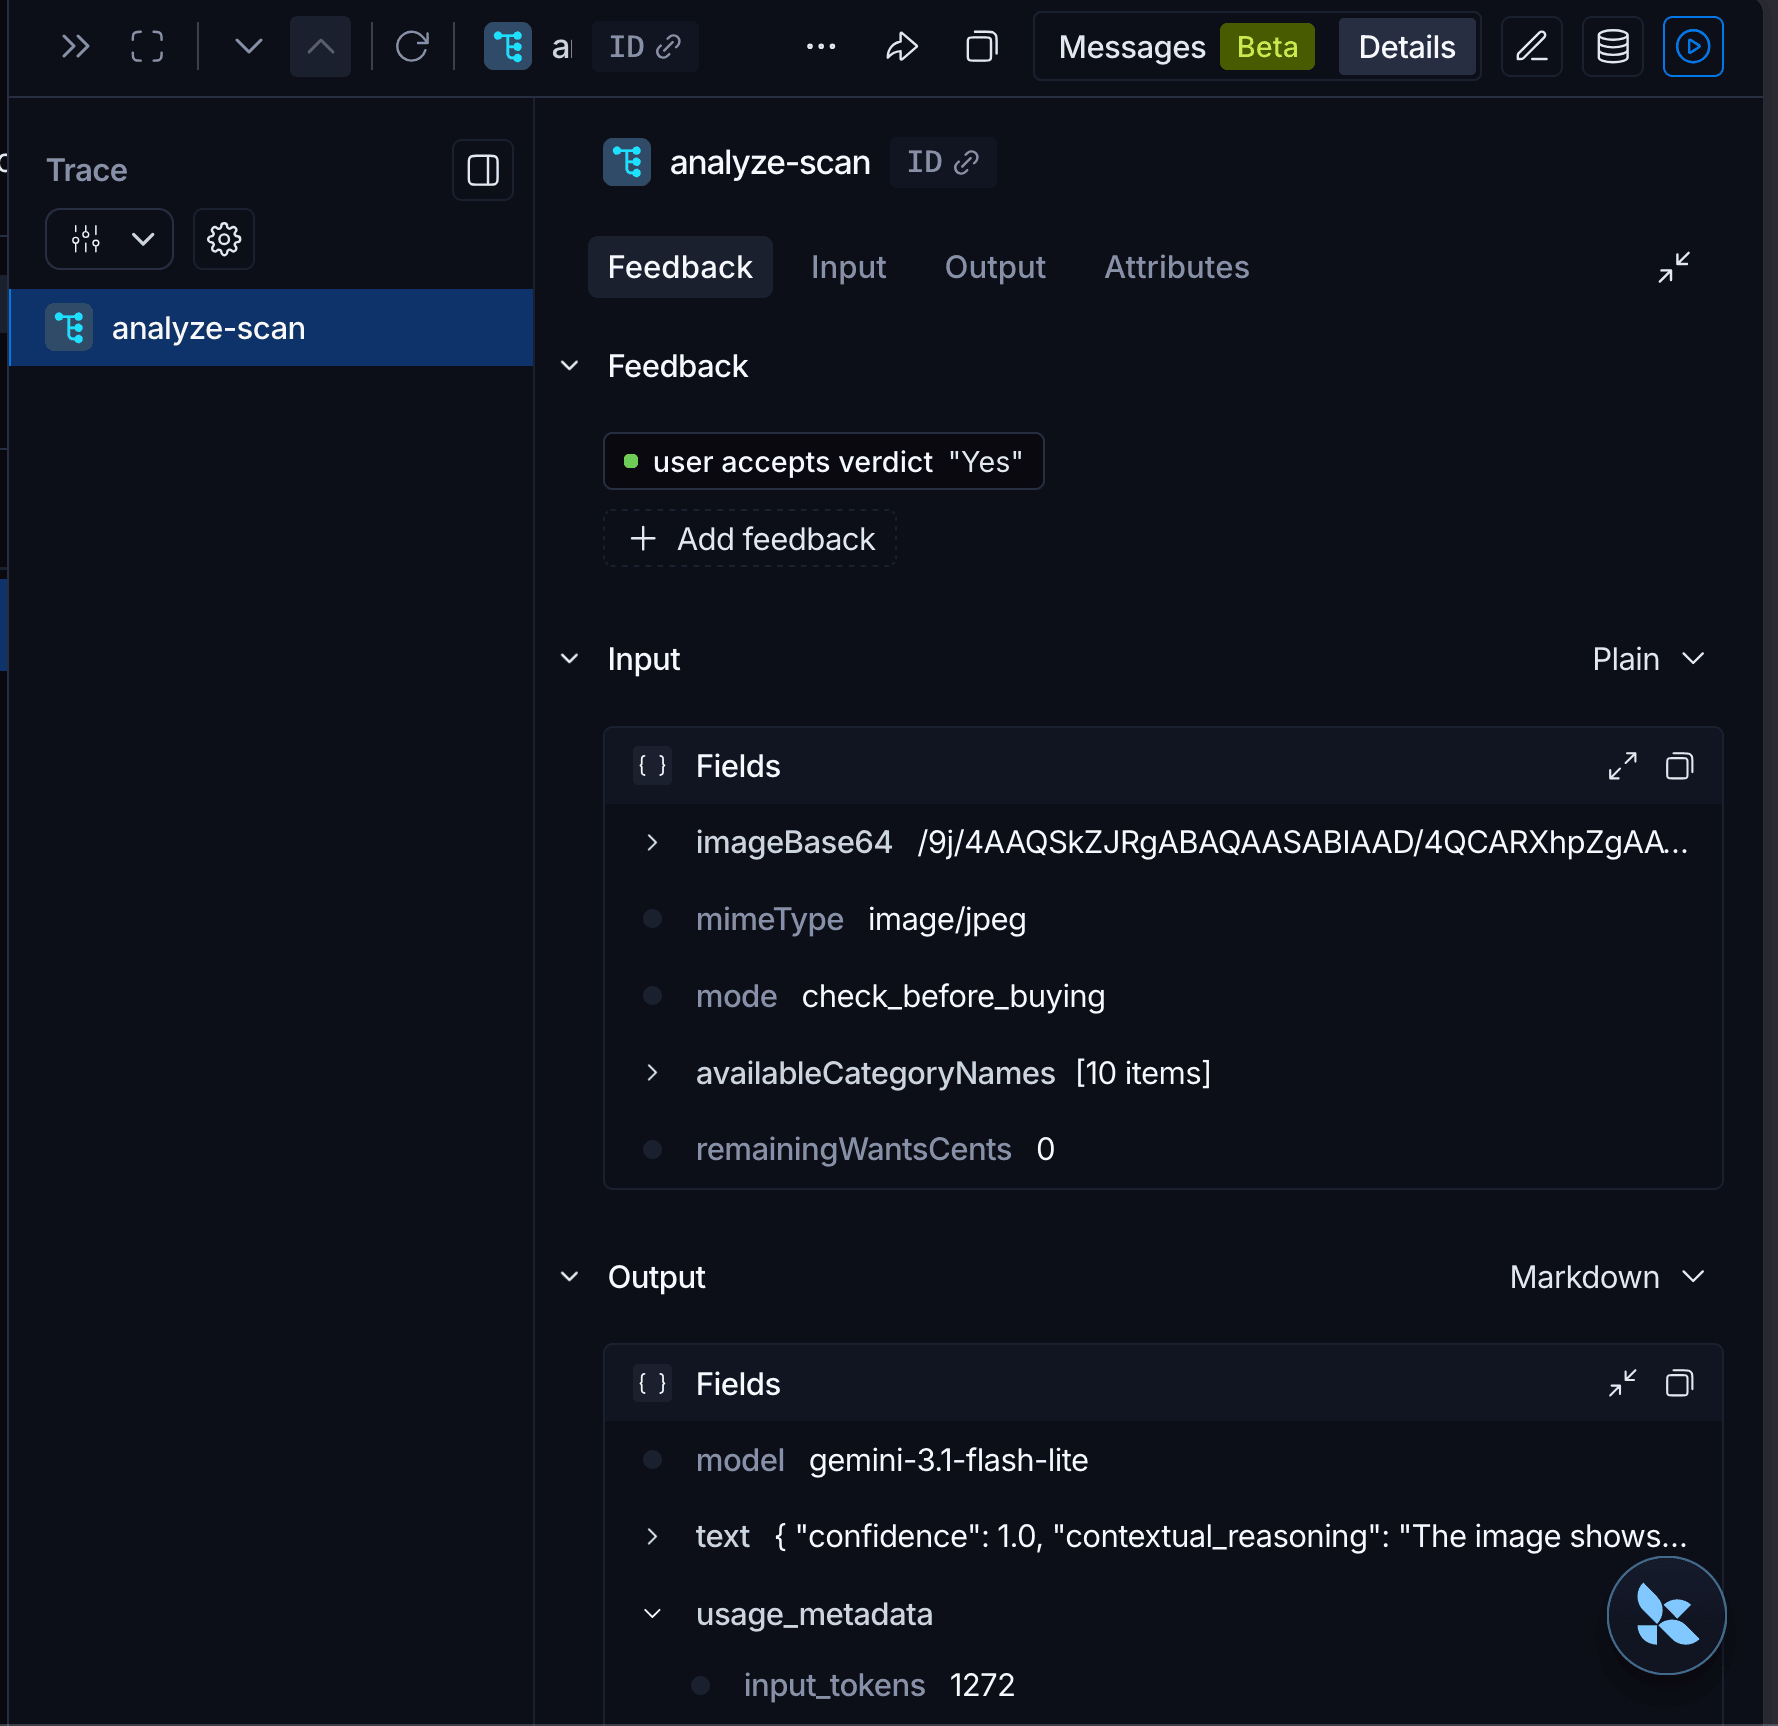
The input side of a real CIBI trace: the receipt image and live budget context sent to Gemini.
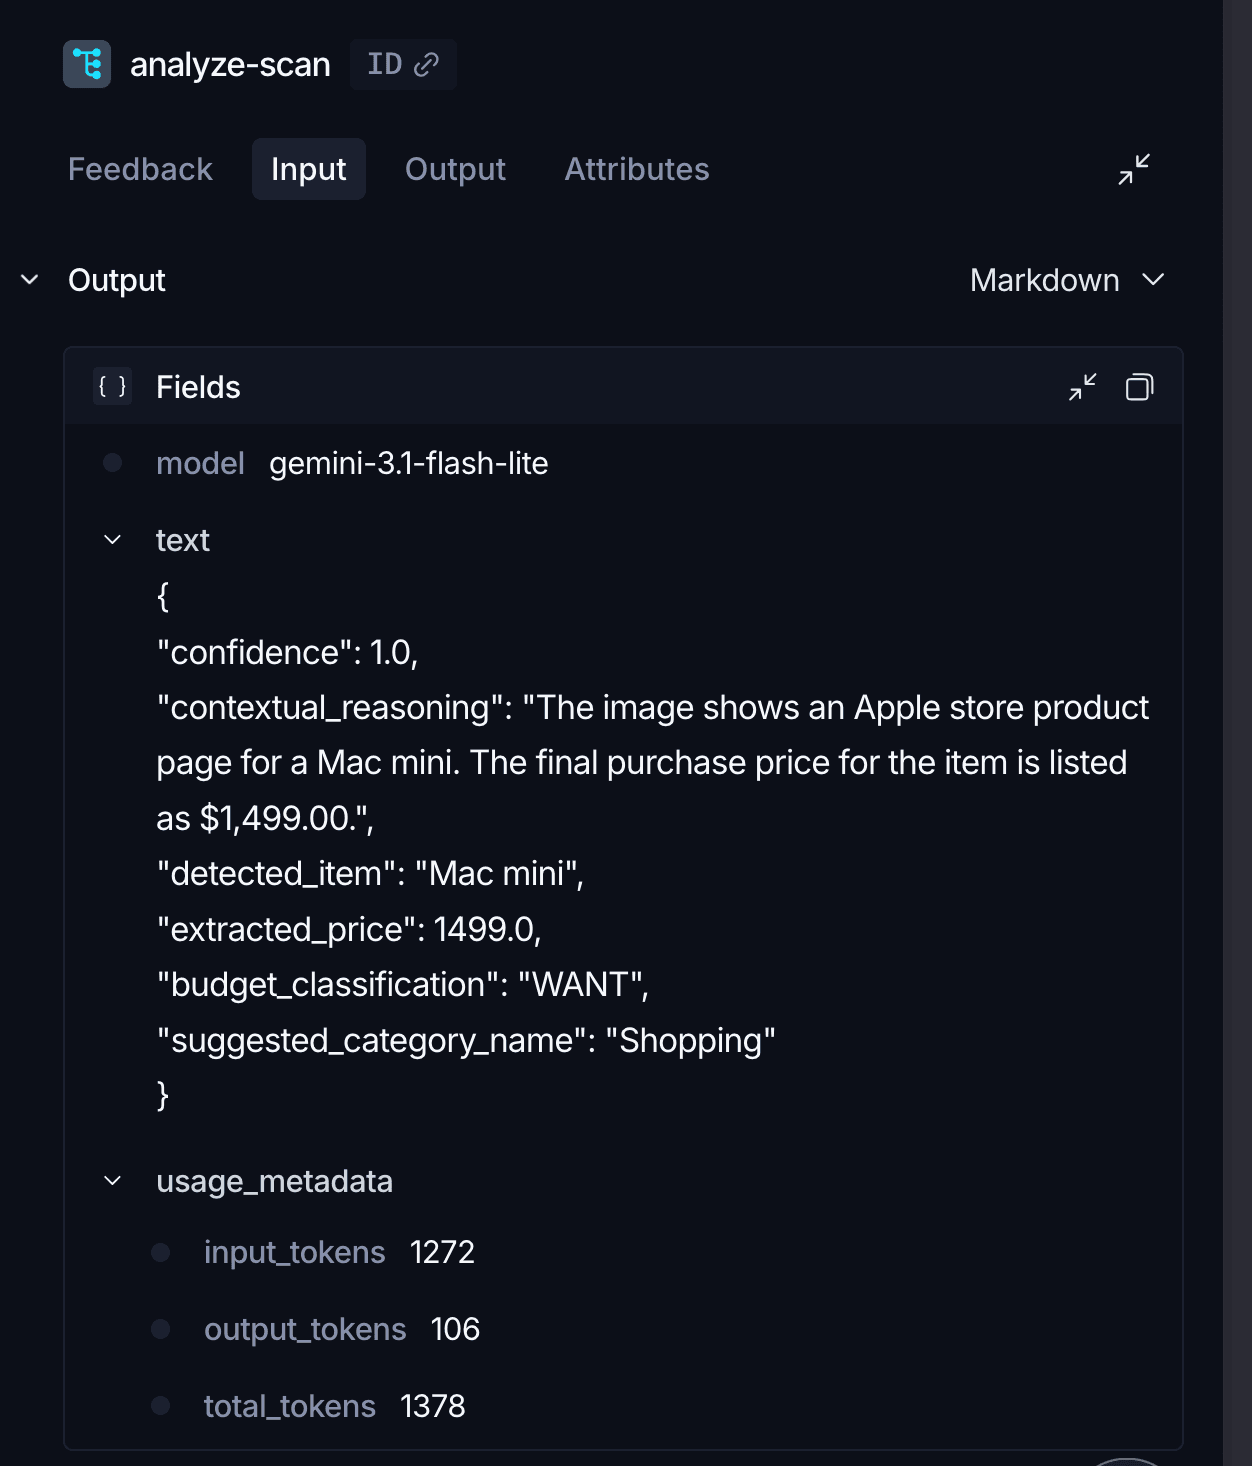
The model's judgment on that same trace: a $1,499 Mac mini, classified as a want, not a need.
The instrumentation is deliberately small. There is no LangChain in the codebase, so no auto-wrapped client exists for @google/genai. Instead, a manual traceable() wrapper (a RunTree underneath) goes around GeminiScanProvider.analyze() in gemini-provider.ts, injected through AnalyzeScanHandlerDeps, the same seam logScanAiEvent already uses, so it stays mockable and never becomes a hard dependency. Full image and budget context go up, one hundred percent sampled, into separate cibi-scan-dev and cibi-scan-prod projects, with scan mode carried as trace metadata rather than split into its own project.
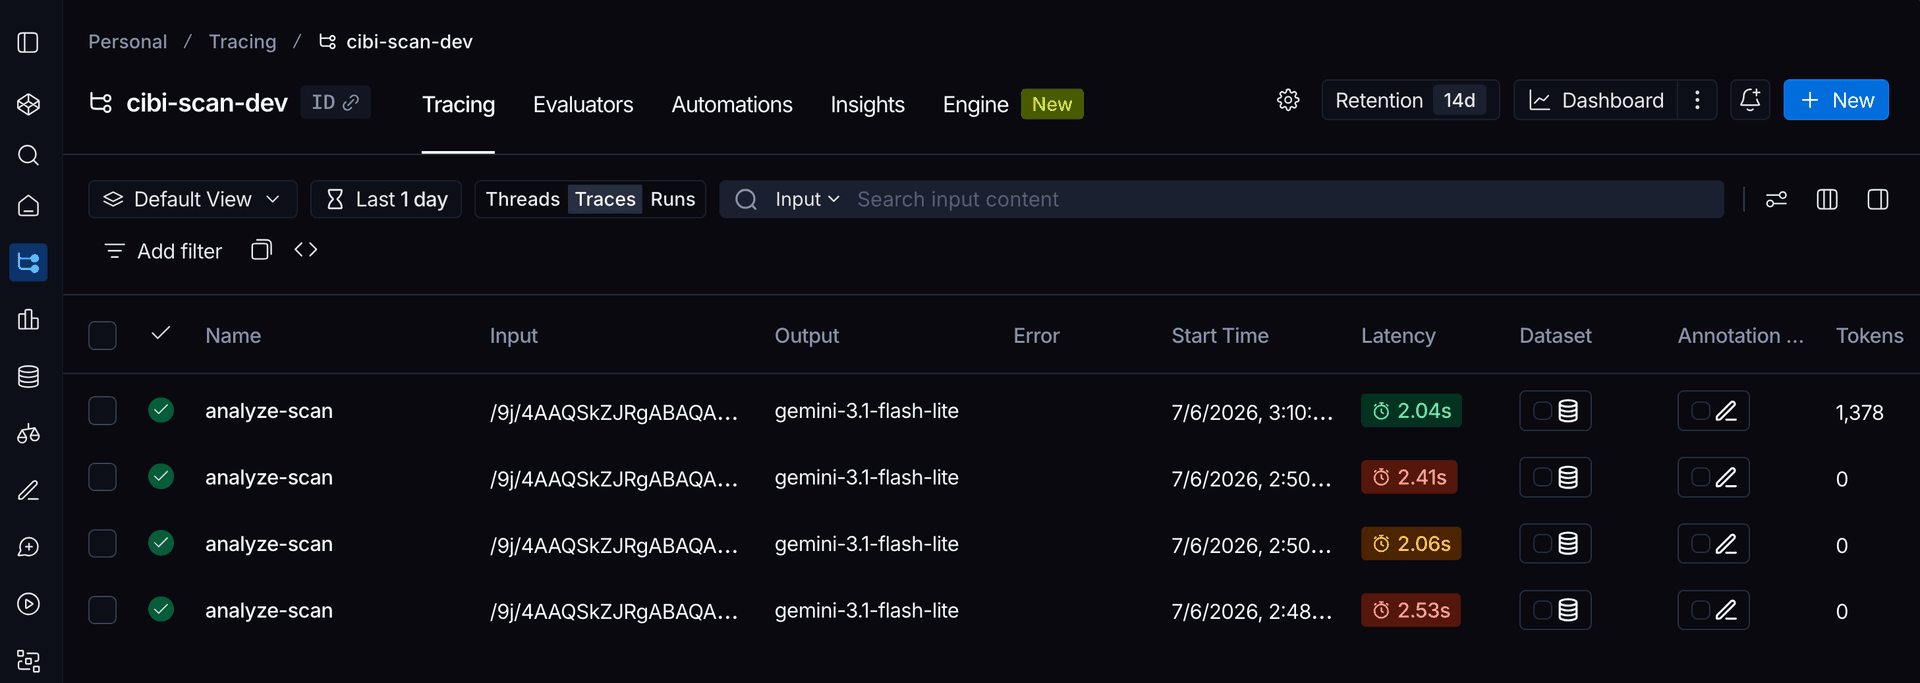
Every analyze-scan run lands here, in the cibi-scan-dev project, ready to inspect or promote into a dataset.
Two records now sit side by side, doing different jobs. The scan_ai_events table in Supabase stays the cheap always-on ledger: every scan, structured, answering what happened and how often. The trace is the rich record, the full image and JSON, answering why this one went wrong. The trace is additive, not a replacement. Evaluation splits the same way: hand-written .test.ts fixtures stay as CI's first line of defense against regressions I can imagine, while the trace datasets accumulate the failures I could never have invented, real receipts crumpled, low-light, half in Arabic and half in French, that beat the model in the wild. Tagging those into datasets is a Phase 2 developer CLI, scripts/flag-scan-trace.ts, scoped to developers, not an in-app button.
None of this was free. Sending receipt images to a third party invalidated a claim already sitting in PRIVACY_POLICY.md and the App Privacy checklist: that the app does not store scan images by default. So the disclosure update, and naming the observability vendor as a processor, was a required part of shipping, not a follow-up. It does not block App Store review; it is a disclosure fix. But shipping the tracing without it would have been the actual bug.
I am also honest about what is still open: whether a telemetry failure can currently block a user's response (it must not), whether a clean dev/prod split exists on the data layer or I am assuming one, and when one hundred percent sampling stops making sense once real volume and cost show up.
The point of the example is the direction of the argument. If observability and evaluation are worth this much care around a single model call, they are worth far more around a real multi-step agent, where the trajectory is long, the state is mutable, and the failure modes compound. The discipline does not begin at two hundred steps. It begins the moment your software judges instead of calculates.
Takeaways
- The trace is your source of truth. Agent behavior only exists at runtime, and the trace is the only place it is recorded. Capture it first; everything else is built on it.
- Match evaluation granularity to the primitive. Runs for decisions, traces for trajectories, threads for conversations, with eyes open about which is cheap and which is brutal.
- Grow your eval suite from production. The strongest test cases are reported, not invented.
- Observability and evaluation are one discipline. The trace that debugs a failure is the trace that evaluates it.
- Tell the truth about what you store. Rich tracing has a privacy cost, and the disclosure is part of shipping.
The verdict looks like math. Treat the judgment underneath it like the judgment it is.
The runs / traces / threads framing here draws on LangChain's "Fundamentals of Agent Observability" guide. The examples, the single-call case study, and the argument are my own, from building CIBI and working on multi-agent systems and their evaluation.
Share this article
Send it to someone who would use the context.
Add your perspective
The thread is stored in GitHub Discussions through Giscus, so the conversation stays portable, moderated on GitHub, and visually aligned with this site.
Loading comments connects to GitHub and may use third-party storage in your browser.